時間:2024-04-15|瀏覽:317
距離USDT.D上次更新已經整整一個月了。鑒于近期山寨股的超賣,整個市場的流動性問題也暴露出來。本文純屬我個人主觀意見。如果你不同意里面的觀點,歡迎友好討論,不然就當我是廢話吧。 首先,本文的基本邏輯是基于“加密貨幣市場的主要流動性來自穩定幣”的前提。如果您認為美元交易對和ETF的資金是價格上漲的核心推動力,那么本文的觀點是錯誤的,您可以直接忽略以下內容; 說到穩定幣,目前USDT、USDC和DAI占據了大部分市場份額。這三種穩定幣是市值最高的三種,占整個穩定幣市場90%以上。曾經占有率比較高的BUSD和TUSD,現在不知道什么原因徹底消失了。 因此,如果我們要判斷市場整體的流動性,不能像我之前的文章中提到的那樣僅僅判斷USDT的市值和占比,而是需要判斷整個穩定幣市場的流動性水平; 如圖所示:

By merging the total market value curves of the three major stablecoins, USDT, USDC, and DAI, we can get the overall magnitude of the market stablecoins, as shown by the blue line in the figure;Adding the historical weekly price curve of BTC at the same time, we can see some interesting signs:1. From the peak of the bull market in 2019 to the first breakthrough of the historical high of BTC price at the end of 2020: the total market value of stablecoins first reached a short-term peak, and there was almost no obvious increase in the subsequent volatility in 2019. It was not until the massive release of money after the epidemic in 2020 that it began to grow significantly;When BTC prices first broke through their all-time highs in 2020, the total market value of stablecoins increased by a total of US$20 billion, an increase of 478%.2. From the end of 2021 when BTC peaked at 69,000 to the present, the total market value of stablecoins first increased in the early stage of the bear market, and then shrank for a long time after reaching the peak, which was accompanied by the recent round of bear market;When the BTC price broke through its all-time high for the first time in 2024, the total market value of stablecoins decreased by a total of US$6 billion, a 4.21% decrease;Based on the above two points, the difference visible to the naked eye appears in the incremental level of the total market value of stablecoins when BTC breaks a new high;Simply put, the emergence of this bull market has hardly benefited from the liquidity provided by stablecoins, which are the most important trading pairs of all currencies in the cryptocurrency market except BTC. In other words, while BTC broke new highs, the liquidity of the entire market was actually insufficient.The reason why BTC can break through its historical high is largely due to the emotional incentives brought by ETFs. Note that I use "emotional incentives" instead of "financial incentives" here. Why do I say that?Let’s look at all the net inflows into the ETFs since their adoption.

As of now, ETFs have a total net inflow of US$12.5 billion. These net inflows seem to be a lot, but if compared with the total market value of stablecoins, they only account for 8.6% of the increase. By the way, the current total market value of stablecoins is about US$145.5 billion.This seems a bit counterintuitive, because the last bull market successfully broke through the new high with an increase of $20 billion in stablecoins, and it never came back. The $12.5 billion added by ETFs in this bull market should also be a lot, right?The problem lies in the total market value of the cryptocurrency market, as shown in the figure:
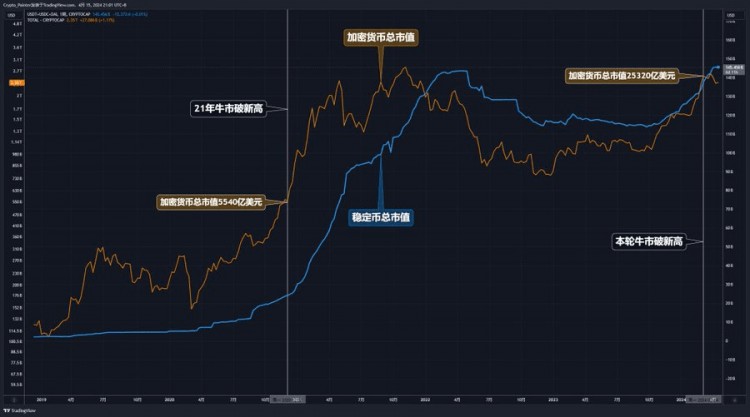
When the all-time high was reached in 2020, the total market value of cryptocurrencies (TOTAL) was approximately US$554 billion, while when the new high was reached in this bull market, the total market value of cryptocurrencies had reached US$2532 billion;Therefore, from 2019 to 2020, the $20 billion in liquidity increase, when BTC broke its all-time high, contributed 3.6% of the liquidity of the entire cryptocurrency market.When this round of bull market broke through the historical high, the $12.5 billion contributed by ETFs accounted for only 0.49% of the liquidity of the entire cryptocurrency market, and this is before taking into account the $60 decline in the market value of stablecoins.Therefore, we can draw a heartbreaking conclusion that this bull market is actually a bull market with extremely scarce liquidity!The cow in front of us is very thirsty and urgently needs lots of water!Well, now we can go back to the phenomenon of oversell of altcoins mentioned at the beginning. While BTC has only pulled back by 10%+, altcoins have experienced a decline comparable to the panic selling in a bear market. The fundamental reason for this is the problem of insufficient liquidity.When BTC's ETF was approved, rumors spread in the market that this round of bull market was a one-man show for BTC. Most traders scoffed at this and proved this statement wrong with their actual actions. After BTC rose to a high point, they actively sold their precious BTC and chose to start investing in various altcoins that were hot or that they thought would become hot.These profit-making funds flowing out of BTC have indeed played a significant role. Compared with BTC, the liquidity of altcoins is an order of magnitude lower, so a small amount of funds flowing out of BTC can cause a significant increase in altcoins;However, since this part of funds is limited after all, we were surprised to find that when BTC had already broken new highs, there was almost no market for altcoins to break new highs. When the market encountered emotional panic, the extremely poor liquidity in turn became a catalyst for rapid oversell; ========================== ====
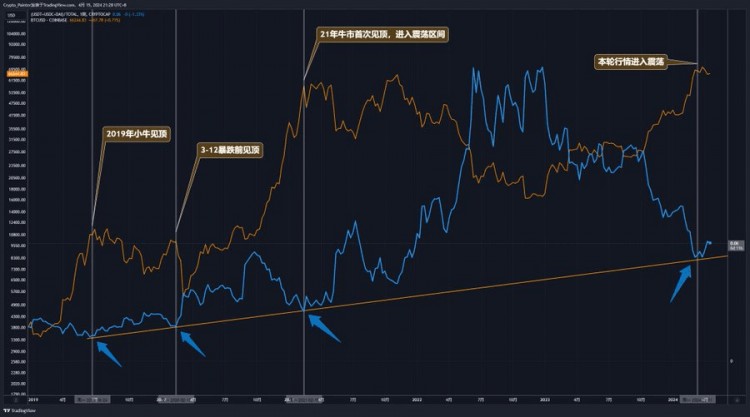
The orange line is the price of BTC, and the blue curve represents the proportion of the three major stablecoins relative to the total market value of cryptocurrencies. Since TradingView does not have this index, I can only write a formula manually and call it "Stable.D" for now.Similar to USDT.D before, Stable.D also has a slowly increasing upward trend line under the conventional coordinates, but if you look closely, or compare it with the chart in the article I quoted below, you will find that the number of times Stable.D touches the lower trend line has been significantly reduced.There are only 4 real contacts visible to the naked eye, they are:1. The Mavericks peaked in 2019;2. The rebound peaked before March 12, 2020;3. The bull market peaked in 2021 and entered a period of volatility;4. This round of bull market has stopped rising and entered a period of volatility;Well, this concludes this analysis of stablecoin market share and liquidity!
I'm not stupid enough to give any subjective conclusions that might offend others! Haha!
However, having said so much, the only nonsense I dare to say is: more stablecoin issuance, ETF net inflows, and loose monetary policy are the driving force behind the current bull market!If you find this article helpful or inspiring, please like, repost, comment and support!
Thanks for reading!